
Analysis of College Scoreboard Data: Identifying key factors in Higher Education on student success
Outlining key findings from Analysis of U.S. college data, this post helps us show what factors lead to high post grad earnings, student retention, and more!

University of Notre Dame (PHOTO: GETTY IMAGES)
Introduction
With a younger sibling soon preparation to make choices about her college education, and a vested interest in the quality of my own college education, I collected data from the College Scoreboard API, made publicly accessible by the U.S Department of Education (For full details on data collection, see my previous blog post here).
After collecting this data, I performed Exploratory Data Analysis (EDA) to discover interesting patterns corresponding to college education and potential postive benefits on students. This blog post outlines the highlights of this EDA.
Preliminary Relationships between Features of Interest
After pondering potential relationships of interest between variables in my dataset, I decided on the following 13 variables that were of most interest for performing EDA:
- School Name
- State
- School Ownership
- Full-time Faculty Rate (%)
- Faculty Average Salary
- Student Enrollment Size
- Retention Rate 4 Yr (%)
- Attendance Cost
- Admission Rate (%)
- SAT Average (Overall)
- Mean Earnings (10 Years after Entry)
- Female Majority indicator variable (
Female_Majority) - Mean Earnings Gender Difference (10 Yrs after Entry) (
MeanEarningsGenderDiff10)
The following correlation matrix helps identify potential relationships between features of interest :
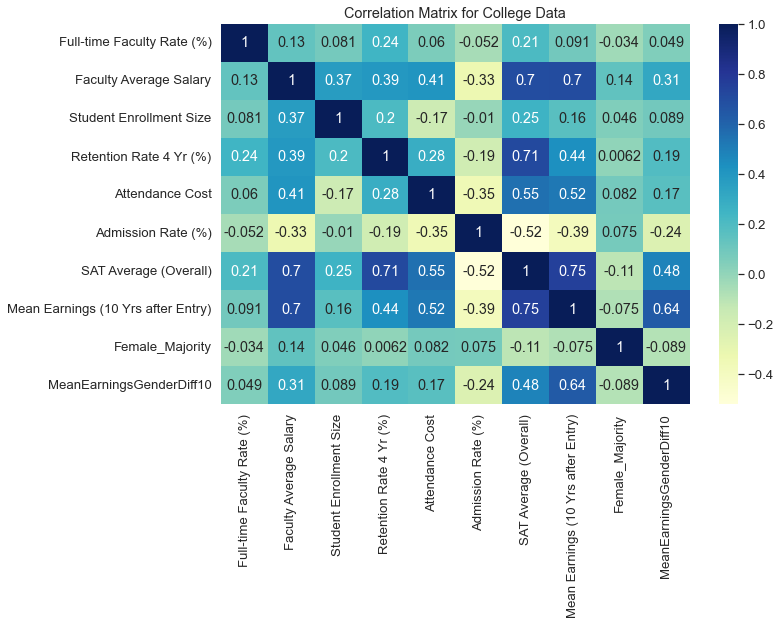
It is clear that several variables, including Mean Earnings (10 Yrs after Entry), Faculty Average Salary, and SAT Average (Overall) have significant correlations with other variables. Using the seaborn python module, I created several plots to further explore these potential relationships. I present several of these plots below with comments on the general trends presented by each of them.
Key Relationships
The following graphics show key relationships presented by the latest College Scoreboard data. Full code for this Exploratory Analysis can be found on my GitHub repos here.
Faculty Average Salary and Mean Earnings (10 Years Post Entry)
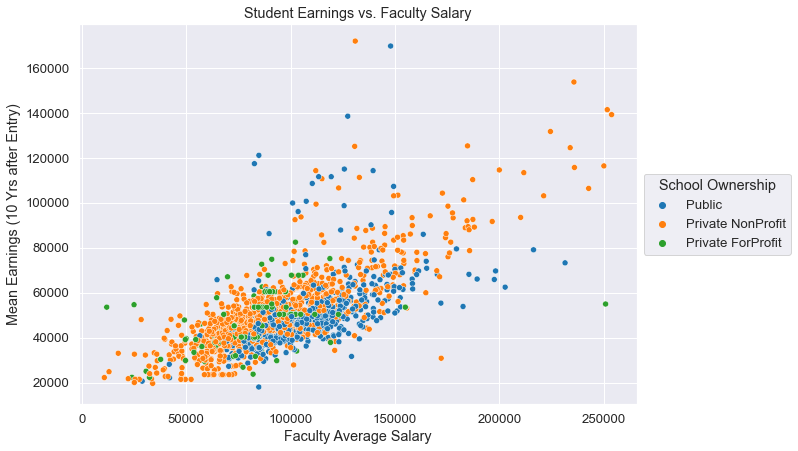
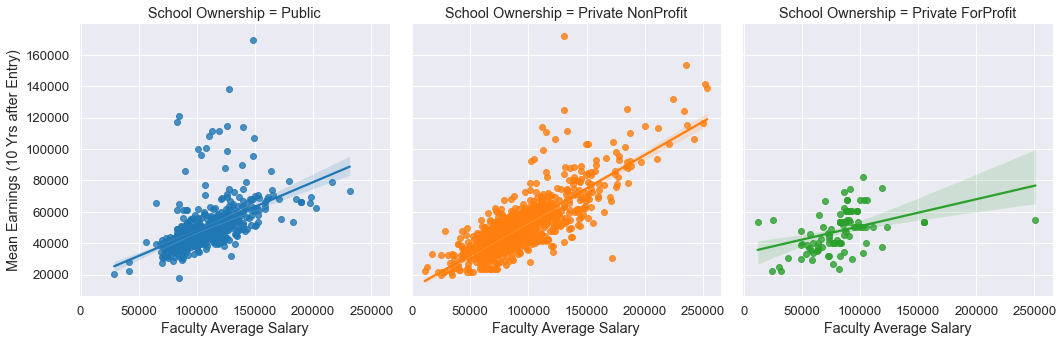
- As shown, there is a clear relationship between Faculty’s Average Annual Salary and the Mean Earnings of students 10 years after entry
- Additionally, it seems this relationship is most clear for Private NonProfit Universities, of which this dataset has the most data
Mean Earnings vs. Attendance Cost
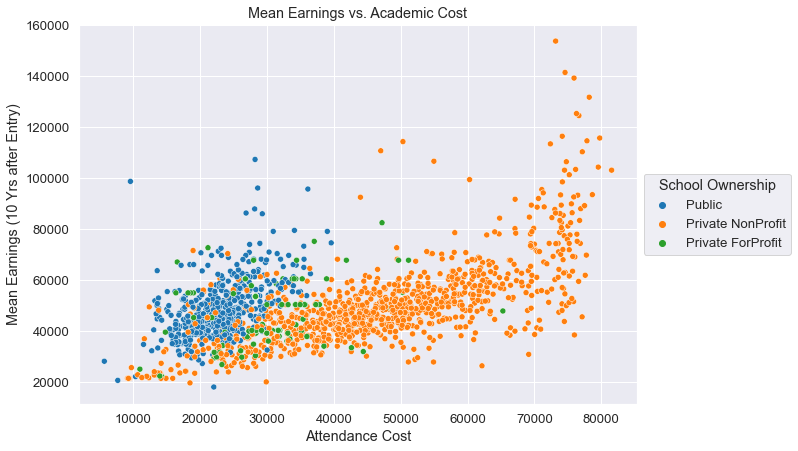
- In general, it seems that higher attendance costs are sometimes associated with higher earnings for students; however, this trend is not extremely strong, and it may be interesting to look further into finding the lowest attendance cost that has optimal expected earnings
Data for specific universities can be examined using the interactive plot below (made with plotly express):
Earnings vs. Admission Rates
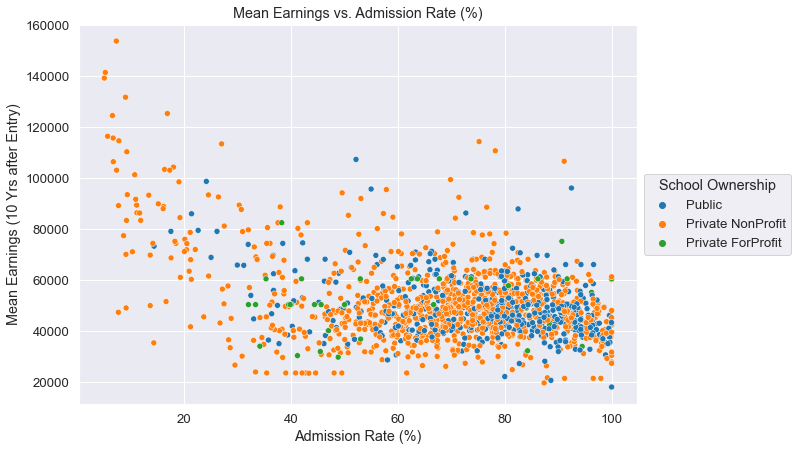
- Students attending schools with higher admission rates seem, on average, to make less than students attending unviersities with steeper admission rates
SAT Scores vs. Mean Earnings (showing Schools with or without Female majority)
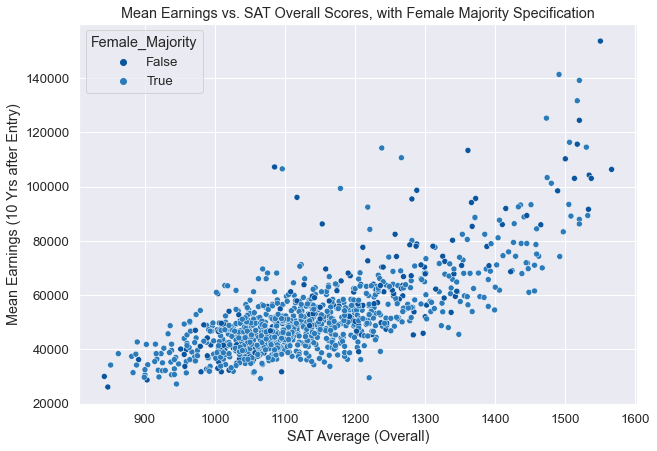
- Higher SAT scores certainly seem associated with higher mean earnings
SAT Scores vs. 4 Yr Retention Rate
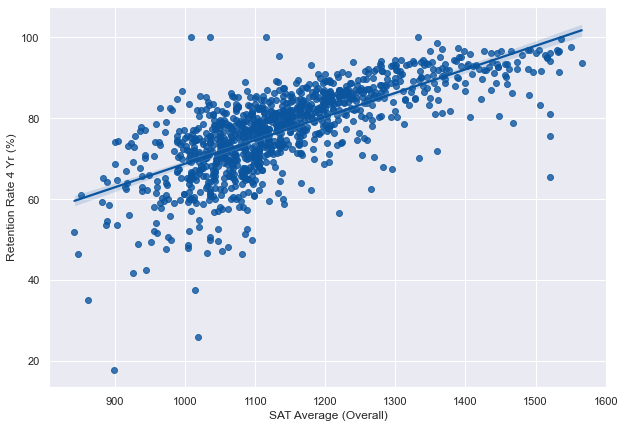
- Higher SAT scores also seem highly related to higher retention rates in students
- This is certainly promising to see this positive relationship, as this metric is often used to determine college readiness
Retention Rates by School Ownership
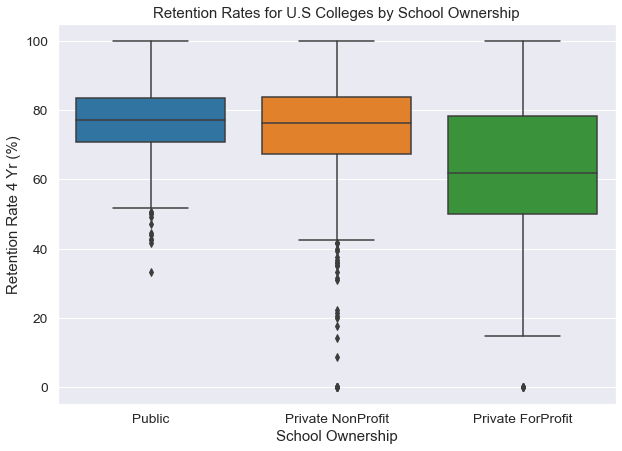
- On average, Private For-Profit unversities seem to have a much lower retention-rate than Private Not-For-Profit universities and Public Universities
SAT Scores vs. Admission Rates
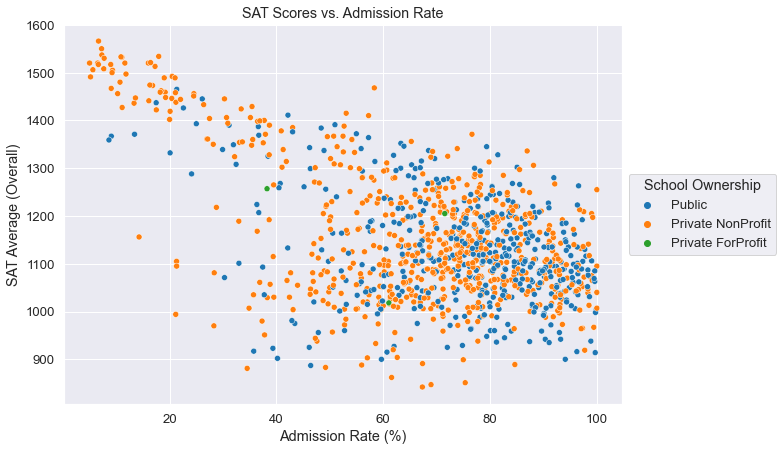
- The relationship presented here is both intuitive and fascinating, as it seems that schools with higher admission rates have a much lower average SAT Overall scores (and vice versa)
Earnings boxplots
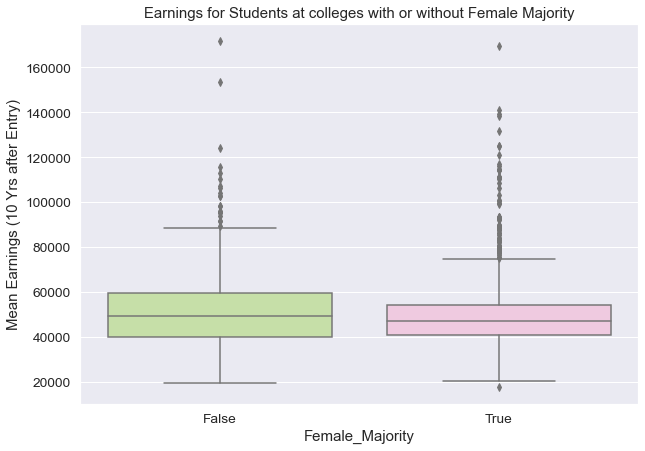
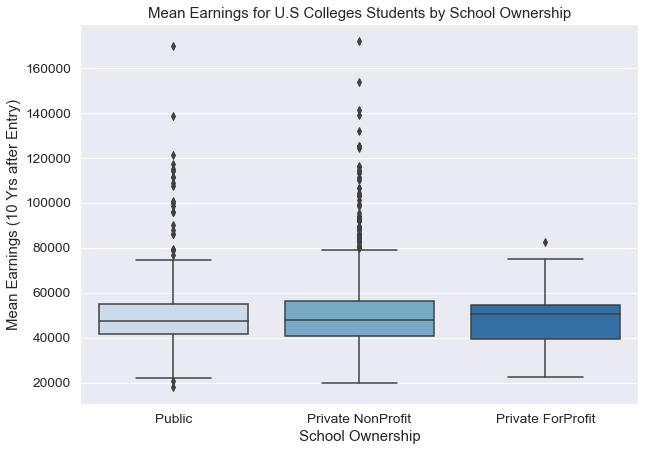
- Overall, it seems that Universities with or without a female majority and across school ownership types seem to have similar expected earnings (10 years after entry), though universities without a female majority seem to have a distribution of mean earnings slightly more spread out
Conclusion
It seems from this analysis that there are several factors influencing the average earnings of students 10 years after entry (where students will have had time to complete advanced degrees, or begin to settle into vocational pursuits). Most interesting of these include cost of attendance, average faculty salary, and admission rates, with school ownership possibly playing a role. However, SAT Overall scores, would many take to represent the level of a students college readiness and intelligence, also seem to have a fairly strong relationship with mean earnings. This variable could possibly explain the same variation in student earnings as admission rates and cost of attendance, as admission rates are usually based on how many students apply with a certain SAT score, and cost of attendance is usually higher for colleges with lower admission rates. These questions and more, are certainly worth looking into further.
So stay tuned for my next blog post where I will explore this data story in more deeply, possibly even building a predictive model to more comprehensively analyze these effects.
As always, please feel free to leave me any comments with feedback on things you liked from this post, or potential questions you may have!