
College Scoreboard: Accessing Higher Education Statistics with US Department of Education API
Education is powerful. This post outlines how to collect data on thousands of Higher Education institutions nationwide.
Introduction
Since the onset of the COVID-19 pandemic, college enrollment in the US has declined for three years straight (as reported by the Washington Post), even with access to information greater than ever before. For both parents and young adolescents, many factors contribute to the decision to enroll in college, and to which institution(s) to enroll, including enrollement size, admission rates, and income after graduation.
Fortunately, the U.S Department of Education has a plethora of data on each of the universities in the United States, that is free for anyone to access after registering for an API key. This data can be used to discover the most desirable colleges in the nation, and will also allow for analysis of the reltionships between different college statistics, such as the relationship between faculty salary and student income 6 years after entry, or between admission rate and completion rate.
Full documentation for this API can be found here: College Scorecard Documentation

A later post will outline exploratory analysis and insights from this dataset to be able to understand key factors in top tier higher education, and which universities qualify as “the top” schools in the nation.
Complete code for this data collection can be found in my GitHub repo: college-score-card-analysis
Data Collection
Tools

Using the requests module within Python, I was able to obtain valuable information on almost 2000 University’s throughout the U.S. via the College Scoreboard government API. However, any resource that allows for API calls will work following a similar process, such as using R’s httr and jsonlite packages. As noted on the College Scorecard website, this data is free and easily accessible by anyone.
As I was working to collect desirable data from the API, I found an extremely helpful GitHub repos from Clarence Li (kiseki1107) which outlined the keys he used to get desired data values from the API. I used his framework for my own data collection, outlined in more detail in Step 4 below.
Steps for collecting data from this wonderful resource are outlined below.
Step 1: Optain API URL and API key
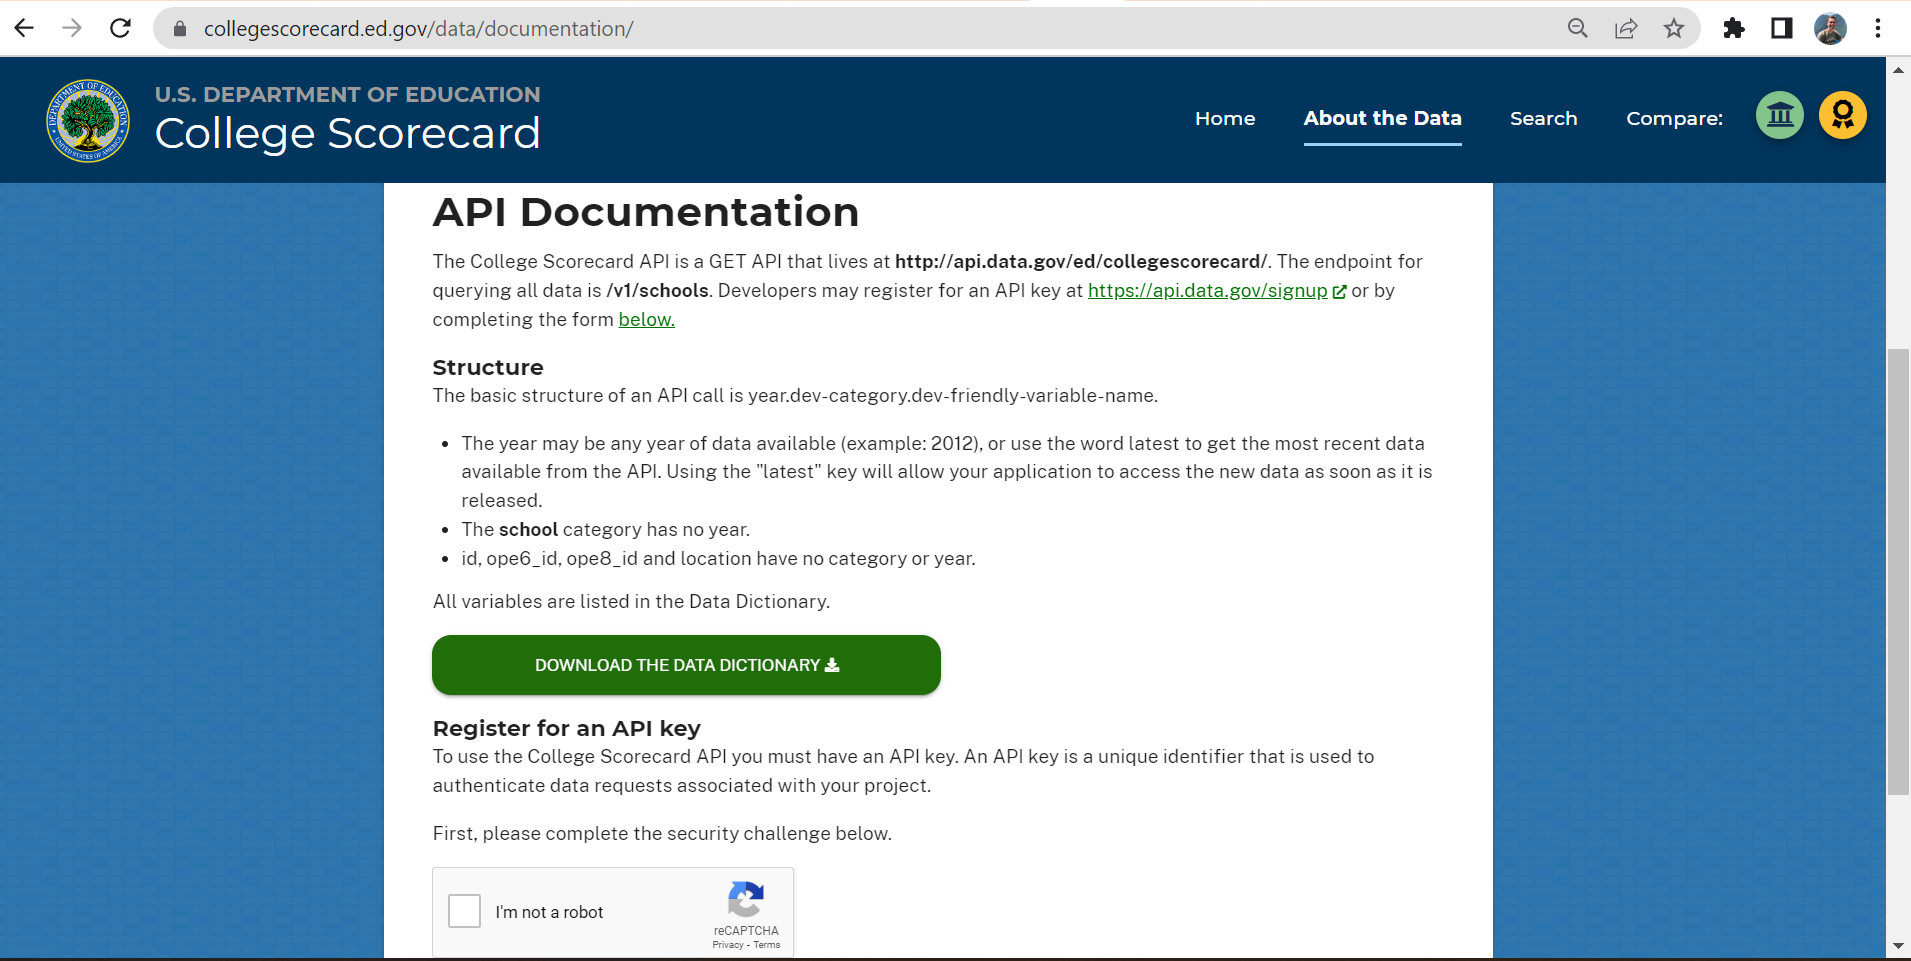
A simple search for “College Scoreboard API” will direct you to data documentation for the Department of Education’s free API. Specified there is the url location of the API http://api.data.gov/ed/collegescorecard/, and the endpoint for querying all data /v1/schools.
# base url
url = "http://api.data.gov/ed/collegescorecard/v1/schools?" # question mark will allow for (optional) arugments to be appended
After saving this url you can register for an API key at the bottom of the page (see image below), which will promptly be sent to you via email.
Look for an email with subject “Your API Key”, from noreply@api.data.gov. Be sure to check your junk mail if it cannot be found in your normal inbox!
Step 2: Prepare API key for GitHub
In order to share the code for data collection without comprimising my API key, I needed to:
- Paste and save the API key into a text file (e.g., “apikey.txt”
- Add the text file name to my .gitignore file, e.g.:
apikey.txt
- Move the text file into my working directory and save it as an object in my Jupyter Notebook:
# load and save api_key
with open('apikey.txt', 'r') as file:
    apikey = file.read()
Step 3: Perform base url API call with base parameters
With the base url ready, I used requests.get() function to extract data from the API. Along with the API key, any conditional parameters should be specified, such as what types of colleges to select from.
# conditional parameters
params = {
    "api_key":apikey,
    "school.degrees_awarded.predominant":"3", # predominantly bachelors degree awarding
    "school.operating":"1" # school operating = True
}
These conditional parameters allow for an API call to ensure api key and query will work, and observe the available data using the .json() method. I also used this already-working url as a based to append my the field urls to below (see Step 4 and 5) in order to query desired variables of interest.
# pull from api using requests and conditional parameters (including api key)
r = requests.get(url, params=params)
r.json()
Example json output:
{'metadata': {'page': 0, 'total': 1989, 'per_page': 20},
 'results': [{'latest': {'school': {'zip': '35762',
     'city': 'Normal',
     'name': 'Alabama A & M University',
     'alias': 'AAMU',
     'state': 'AL',
 ...
 }
Information on the the developer friendly codes for these and other field parameters can be found in the full College Scorecard Data Dictionary
Step 4: Store field parameters of interest as dictionary and URL string
As with the conditional parameters, extraction of desired data variables from the json file, the correct listings on the dictionary must be specified. For example, the following dictionary, which I used, allows for extraction of 40 different variables related to School, Cost, Admission, and Earnings.
# Dictionary of all desired fields
year = "latest" # get latest data
fields = {
      # School Category
      "School Name": "school.name",
      "School ID": "id",
      "School State": "school.state",
      "School Ownership": "school.ownership",
      "Full-time Faculty Rate (%)": "school.ft_faculty_rate",
      "Faculty's average salary per month": "school.faculty_salary",
      # Student Category
      "Student Enrollment Size": year + ".student.size",
      "Student Enrollment All": year + ".student.enrollment.all",
      "Male Students (%)": year + ".student.demographics.men",
      "Female Students (%)": year + ".student.demographics.women",
      "Retention Rate 4 Yr (%)": year + ".student.retention_rate.four_year.full_time",
      # Cost Category
      "Attendance Cost per Academic Year": year + ".cost.attendance.academic_year",
      # Completion Category
      "150% Completion Rate at 4 Yr (%)": year + ".completion.completion_rate_4yr_150nt",
      # Admissions Category
      "Admission Rate (%)": year + ".admissions.admission_rate.overall",
      "SAT Average Overall": year + ".admissions.sat_scores.average.overall",
      "SAT 75th Percentile Critical Math": year + ".admissions.sat_scores.75th_percentile.math",
      "SAT 75th Percentile Critical Reading": year + ".admissions.sat_scores.75th_percentile.critical_reading",
      "SAT 75th Percentile Critical Writing": year + ".admissions.sat_scores.75th_percentile.writing",
      ## Earnings Category
      # 6 Years after Enrollment:
      "Mean Earnings (6 Yrs after Entry)": year + ".earnings.6_yrs_after_entry.working_not_enrolled.mean_earnings",
      "Mean Male Earnings (6 Yrs after Entry)": year + ".earnings.6_yrs_after_entry.mean_earnings.male_students",
      "Mean Female Earnings (6 Yrs after Entry)": year + ".earnings.6_yrs_after_entry.mean_earnings.female_students",
      "Std. Deviation Earning (6 Yrs after Entry)": year + ".earnings.6_yrs_after_entry.working_not_enrolled.std_dev",
      "Percent of Students Earning >$25K (6 Yrs after Entry)": year + ".earnings.6_yrs_after_entry.percent_greater_than_25000",
      "Low Income Students (6 Yrs after Entry)": year + ".earnings.6_yrs_after_entry.working_not_enrolled.income.lowest_tercile",
      "Medium Income Students (6 Yrs after Entry)": year + ".earnings.6_yrs_after_entry.working_not_enrolled.income.middle_tercile",
      "High Income Students (6 Yrs after Entry)": year + ".earnings.6_yrs_after_entry.working_not_enrolled.income.highest_tercile",
      "Mean Earnings Low (6 Yrs after Entry)": year + ".earnings.6_yrs_after_entry.mean_earnings.lowest_tercile",
      "Mean Earnings Medium (6 Yrs after Entry)": year + ".earnings.6_yrs_after_entry.mean_earnings.middle_tercile",
      "Mean Earnings High (6 Yrs after Entry)": year + ".earnings.6_yrs_after_entry.mean_earnings.highest_tercile",
      # 10 Years after Enrollment:
      "Mean Earnings (10 Yrs after Entry)": year + ".earnings.10_yrs_after_entry.working_not_enrolled.mean_earnings",
      "Mean Male Earnings (10 Yrs after Entry)": year + ".earnings.10_yrs_after_entry.mean_earnings.male_students",
      "Mean Female Earnings (10 Yrs after Entry)": year + ".earnings.10_yrs_after_entry.mean_earnings.female_students",
      "Std. Deviation Earning (10 Yrs after Entry)": year + ".earnings.10_yrs_after_entry.working_not_enrolled.std_dev",
      "Percent of Students Earning >$25K (10 Yrs after Entry)": year + ".earnings.10_yrs_after_entry.percent_greater_than_25000",
      "Low Income Students (10 Yrs after Entry)": year + ".earnings.10_yrs_after_entry.working_not_enrolled.income.lowest_tercile",
      "Medium Income Students (10 Yrs after Entry)": year + ".earnings.10_yrs_after_entry.working_not_enrolled.income.middle_tercile",
      "High Income Students (10 Yrs after Entry)": year + ".earnings.10_yrs_after_entry.working_not_enrolled.income.highest_tercile",
      "Mean Earnings Low (10 Yrs after Entry)": year + ".earnings.10_yrs_after_entry.mean_earnings.lowest_tercile",
      "Mean Earnings Medium (10 Yrs after Entry)": year + ".earnings.10_yrs_after_entry.mean_earnings.middle_tercile",
      "Mean Earnings High (10 Yrs after Entry)": year + ".earnings.10_yrs_after_entry.mean_earnings.highest_tercile"
     }
The values from this dictionary (i.e., the developer friendly codes) should be appended together into one fields url string, that can be used for the full API query to make a full dataset of interest. As noted earlier, Clarence Li’s GitHub repos ws the source of this portion of the code.
Code to organize field parameter values together into one url:
# Appending all the fields values together into one "fields_url"
fields_url = ""
for key, val in fields.items():
    fields_url = fields_url + val + ","

# To remove the extra "," at the end of fields_url
fields_url = fields_url[:-1]
fields_url
Step 5: Gather corresponding data of interest
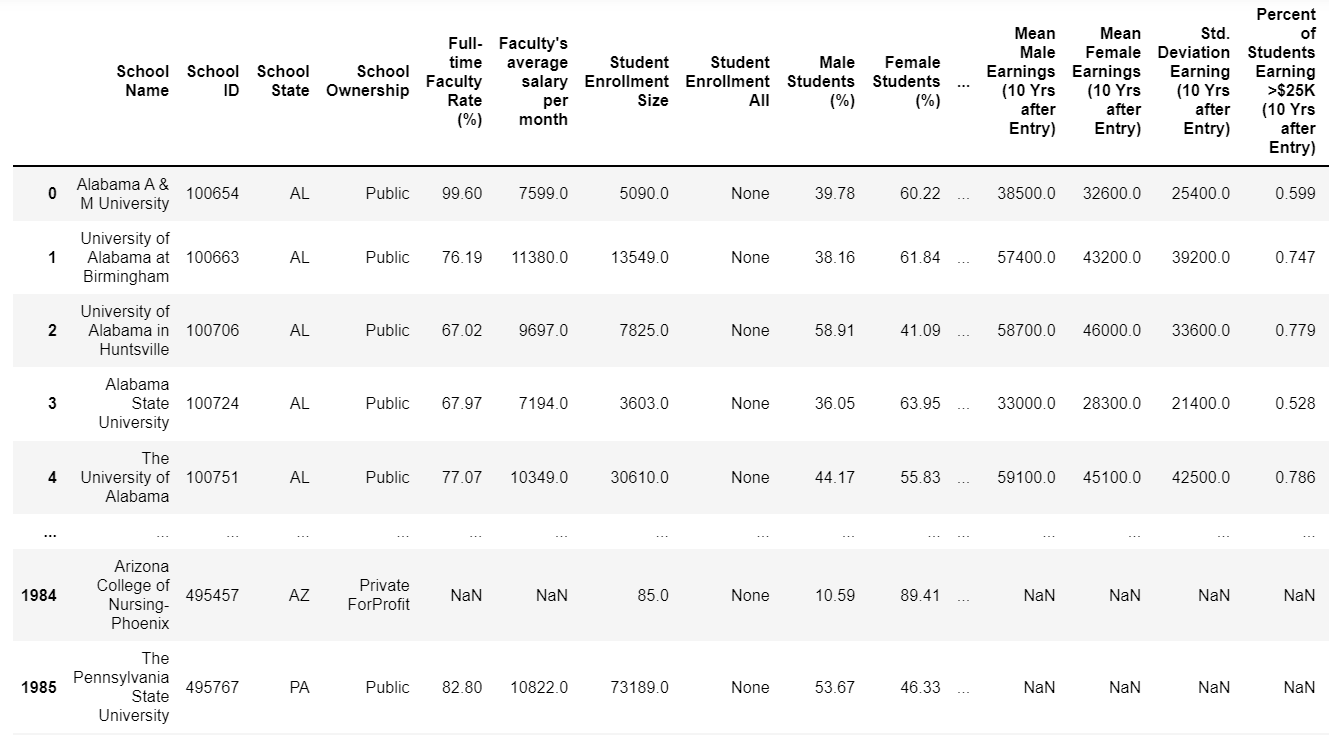
Lastly, using the meta data to extract how many pages are available that match my conditional parameters, I used a loop functionality (as used by Clarence Li) to get information from almost 2000 predominately bacehlor’s degree awarding universities (100 per page for 20 pages). As show below, the keys in the fields dictionary are used as variable names, while the values pulled in the API query are used as the data values.
# get and save max page number
max_page_num = r.json()['metadata']['total']//100 + 1

# Construct df via looping through all pages
college_df = []
per_page = 100

for page_num in range(0,max_page_num):
    query_url = f'{r.url}&fields={fields_url}&page={page_num}&_per_page={per_page}'
    response = requests.get(query_url).json()

    for i in range(len(response["results"])):
        result_row = {}

        for key, val in fields.items(): # set key as var name and value as value
            try:
                result_row[key] = response["results"][i][val]
            except KeyError:
                print(f"{key} key not found")

        college_df.append(result_row)

college_df = pd.DataFrame(college_df)
And with that, here is my data!
Conclusion
I was able to collect data regarding approximately 2000 universities in the United States from the College Scorecard API. The resulting dataset contains 40 descriptive variables that can be used to compare universities, and to understand general trends and patterns among higher education institutions, including what makes certain universities “the best”. I am excited to further analyze this data to help those deciding on their own college education on where the right place to study is for them, as well as developing insights into what parts of university structure lead to higher earnings by graduates, higher retention of students, and the role of univeristy size in these variables.
Massachusetts Institute of Technology

In the next post I will perform this analysis outlining interesting relationships between the myriad of college statistics now contained in my dataset. In the mean time, I challenge you to:
- Collect your own data from the College Scorecard API
- Give me feedback on any issues you run into, and
- Prepare to analyze the data yourself!